Data science · AI tools · Websites
AI-built toolsthat run your business.
Arvelops is led by data scientist Luis Arvelo. We build dashboards, automations and websites with AI — from the data underneath to the page your clients see.
$7,375 in untracked spending identified in the first month
Financial OS
Paper work orders → a mobile app
Tech Core PO
Accounts receivable report, automated daily
Invoice report
Monthly report: 30–45 min by hand → 2 files uploaded
Contact center analytics

Who builds this
Luis Arvelo
Data Scientist & AI Developer · Founder of Arvelops
I'm a data scientist with experience in data analysis, engineering and science. I build AI-powered tools — dashboards, automations and websites — that turn how a business runs into systems that work and numbers managers can trust.
Certifications
- AI Fundamentals
- IBM AI DeveloperIn progress
- IBM Data SciencePlanned
Stack
- Python
- SQL
- Claude Code
- JavaScript
- Next.js
What we build
From the data underneath to the page your clients see.
01/Dashboards & analytics
Reports management uses every day.
The numbers update themselves, and the dashboard says what changed and why it matters. This one replaced a monthly statistic that was typed into spreadsheets by hand.
See the case02/AI automation & apps
Whole processes that run on their own.
A receivables report that builds itself every morning. A work order the analyst assigns and the technician closes from their phone, on site, signature included.
See the case03/Websites & digital presence
Websites built to win clients.
Websites and landing pages made to bring in clients, with every lead connected to your data instead of lost in an inbox.
See this project live04/Data science
The questions a spreadsheet can't answer.
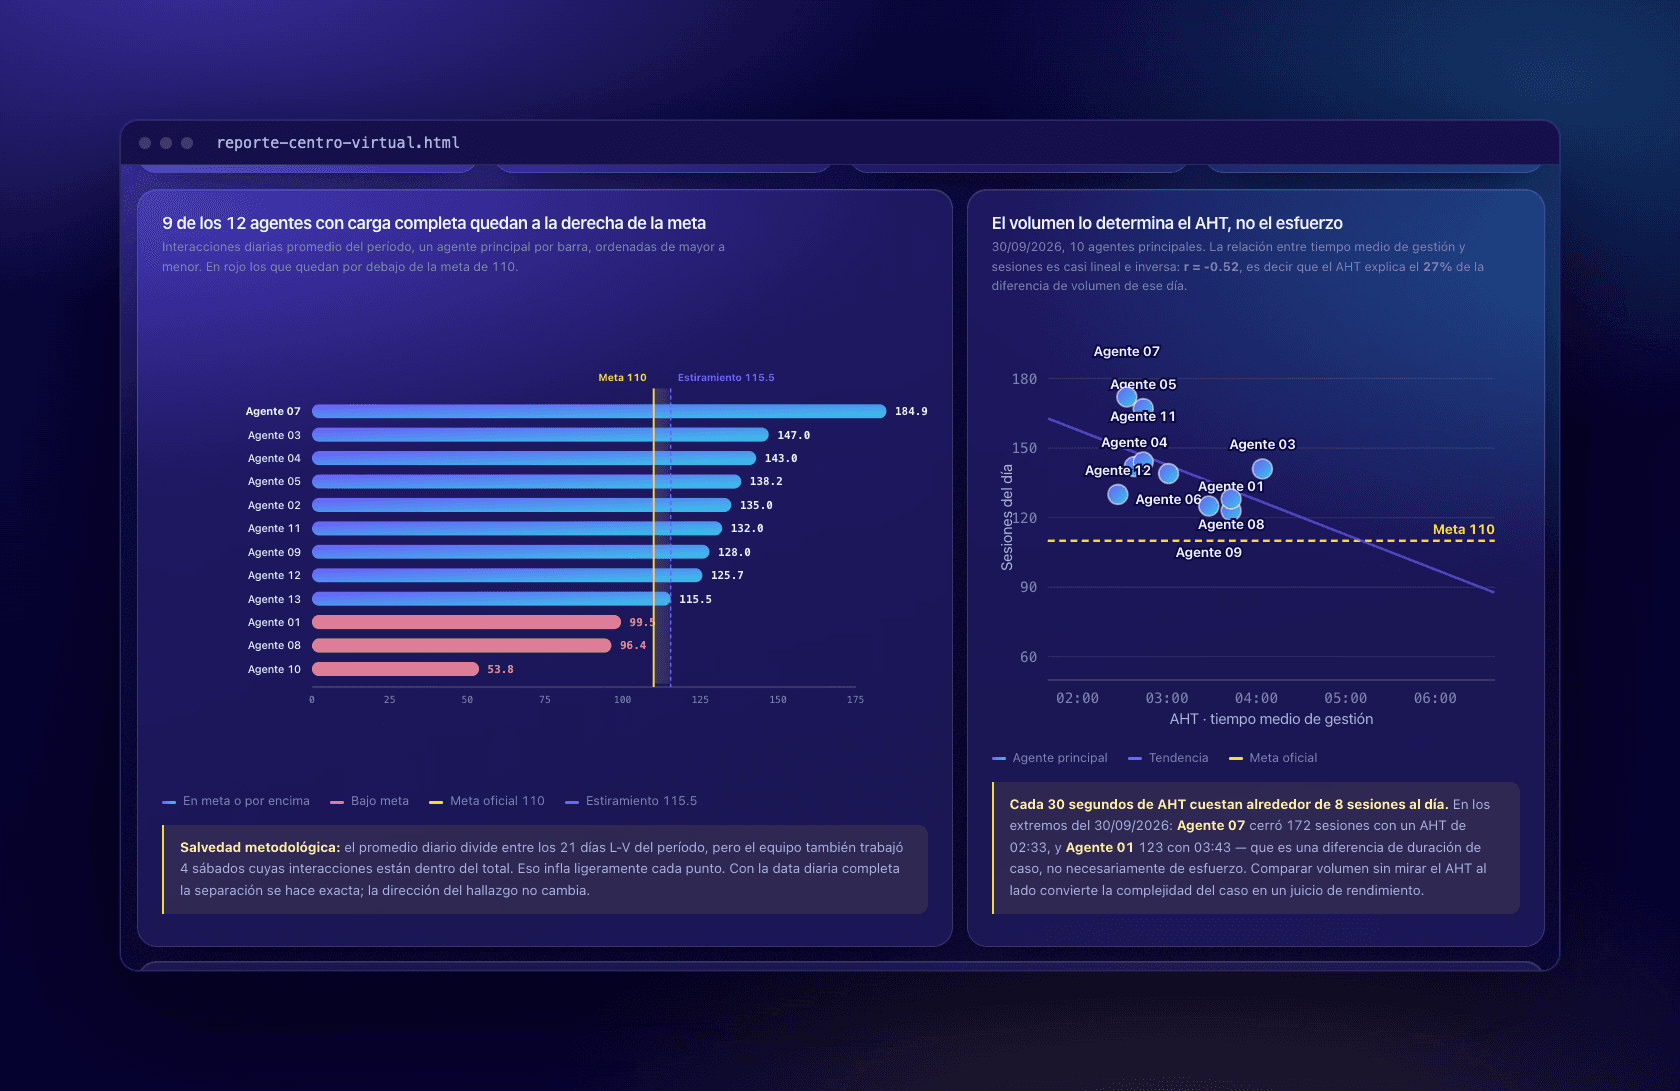
Models, forecasts, risk scoring and statistical analysis. Here: how much of the gap in volume between agents is explained by handle time, not effort.
05/Underneath all of it
Data engineering.
SQL databases where the numbers add up. None of the screens above work if the data underneath is a mess — this is the part that makes them agree.
See the caseFeatured case · Core Climate
One data backbone for a service company.
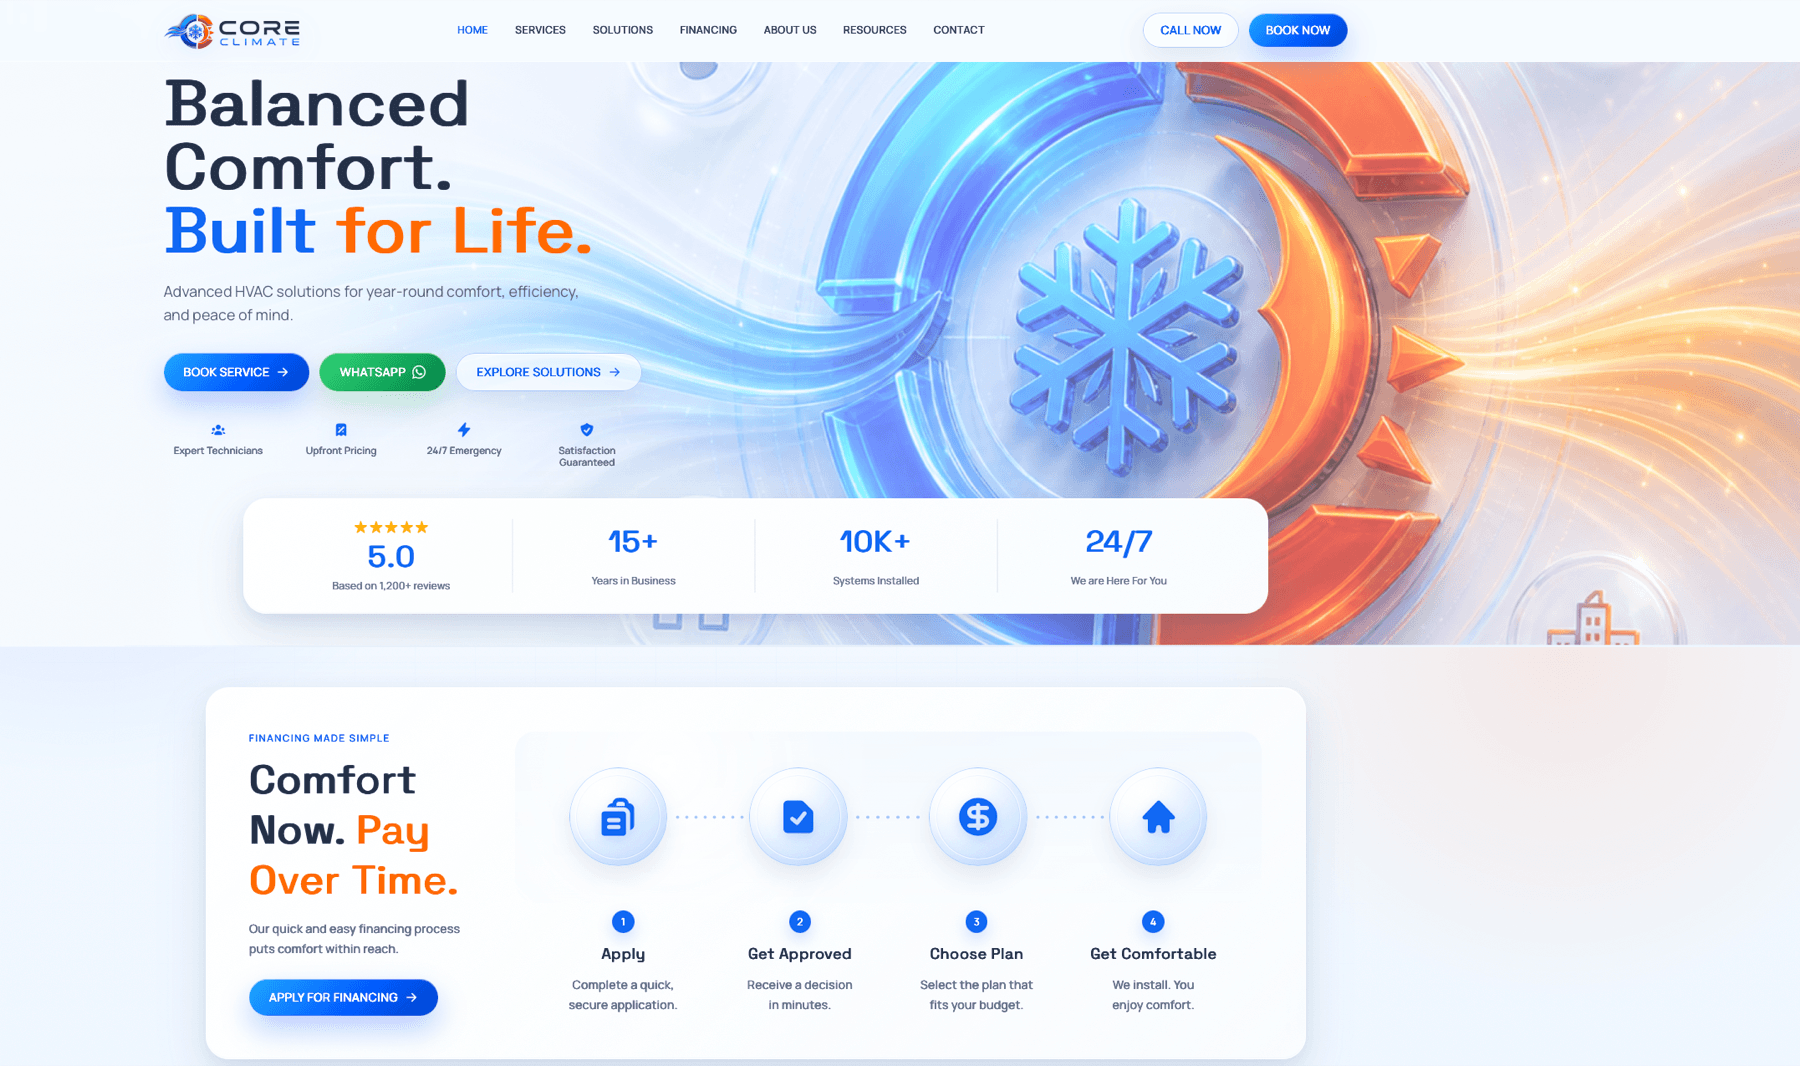
A heating and cooling company in Central Pennsylvania. Three systems and a website, built as one: the field, billing and the books run on the same data, and the website is the part clients see.
Public face
coreclimatehvac.com
Field
Tech Core PO
Work orders · materials · hours
Billing
Invoice report
Invoices · collections · aging
Finance
Financial OS
Cash · costs · alerts
One shared data backbone
Featured case · Data & dashboards
Contact center analytics for an electricity distributor.
Virtual customer service department of an electricity distribution company · Dominican Republic
Before
The monthly statistic was built by hand in spreadsheets: 30–45 minutes every month, with no breakdown per operator and no context for absences.
Now
Two exported files go in. Out comes a dashboard that writes the period's finding, adjusts every metric by effective days, and breaks it down per operator and per day.
From 30–45 minutes of manual work to uploading 2 files.
The time that went into updating now goes into analysing and deciding.
See the full case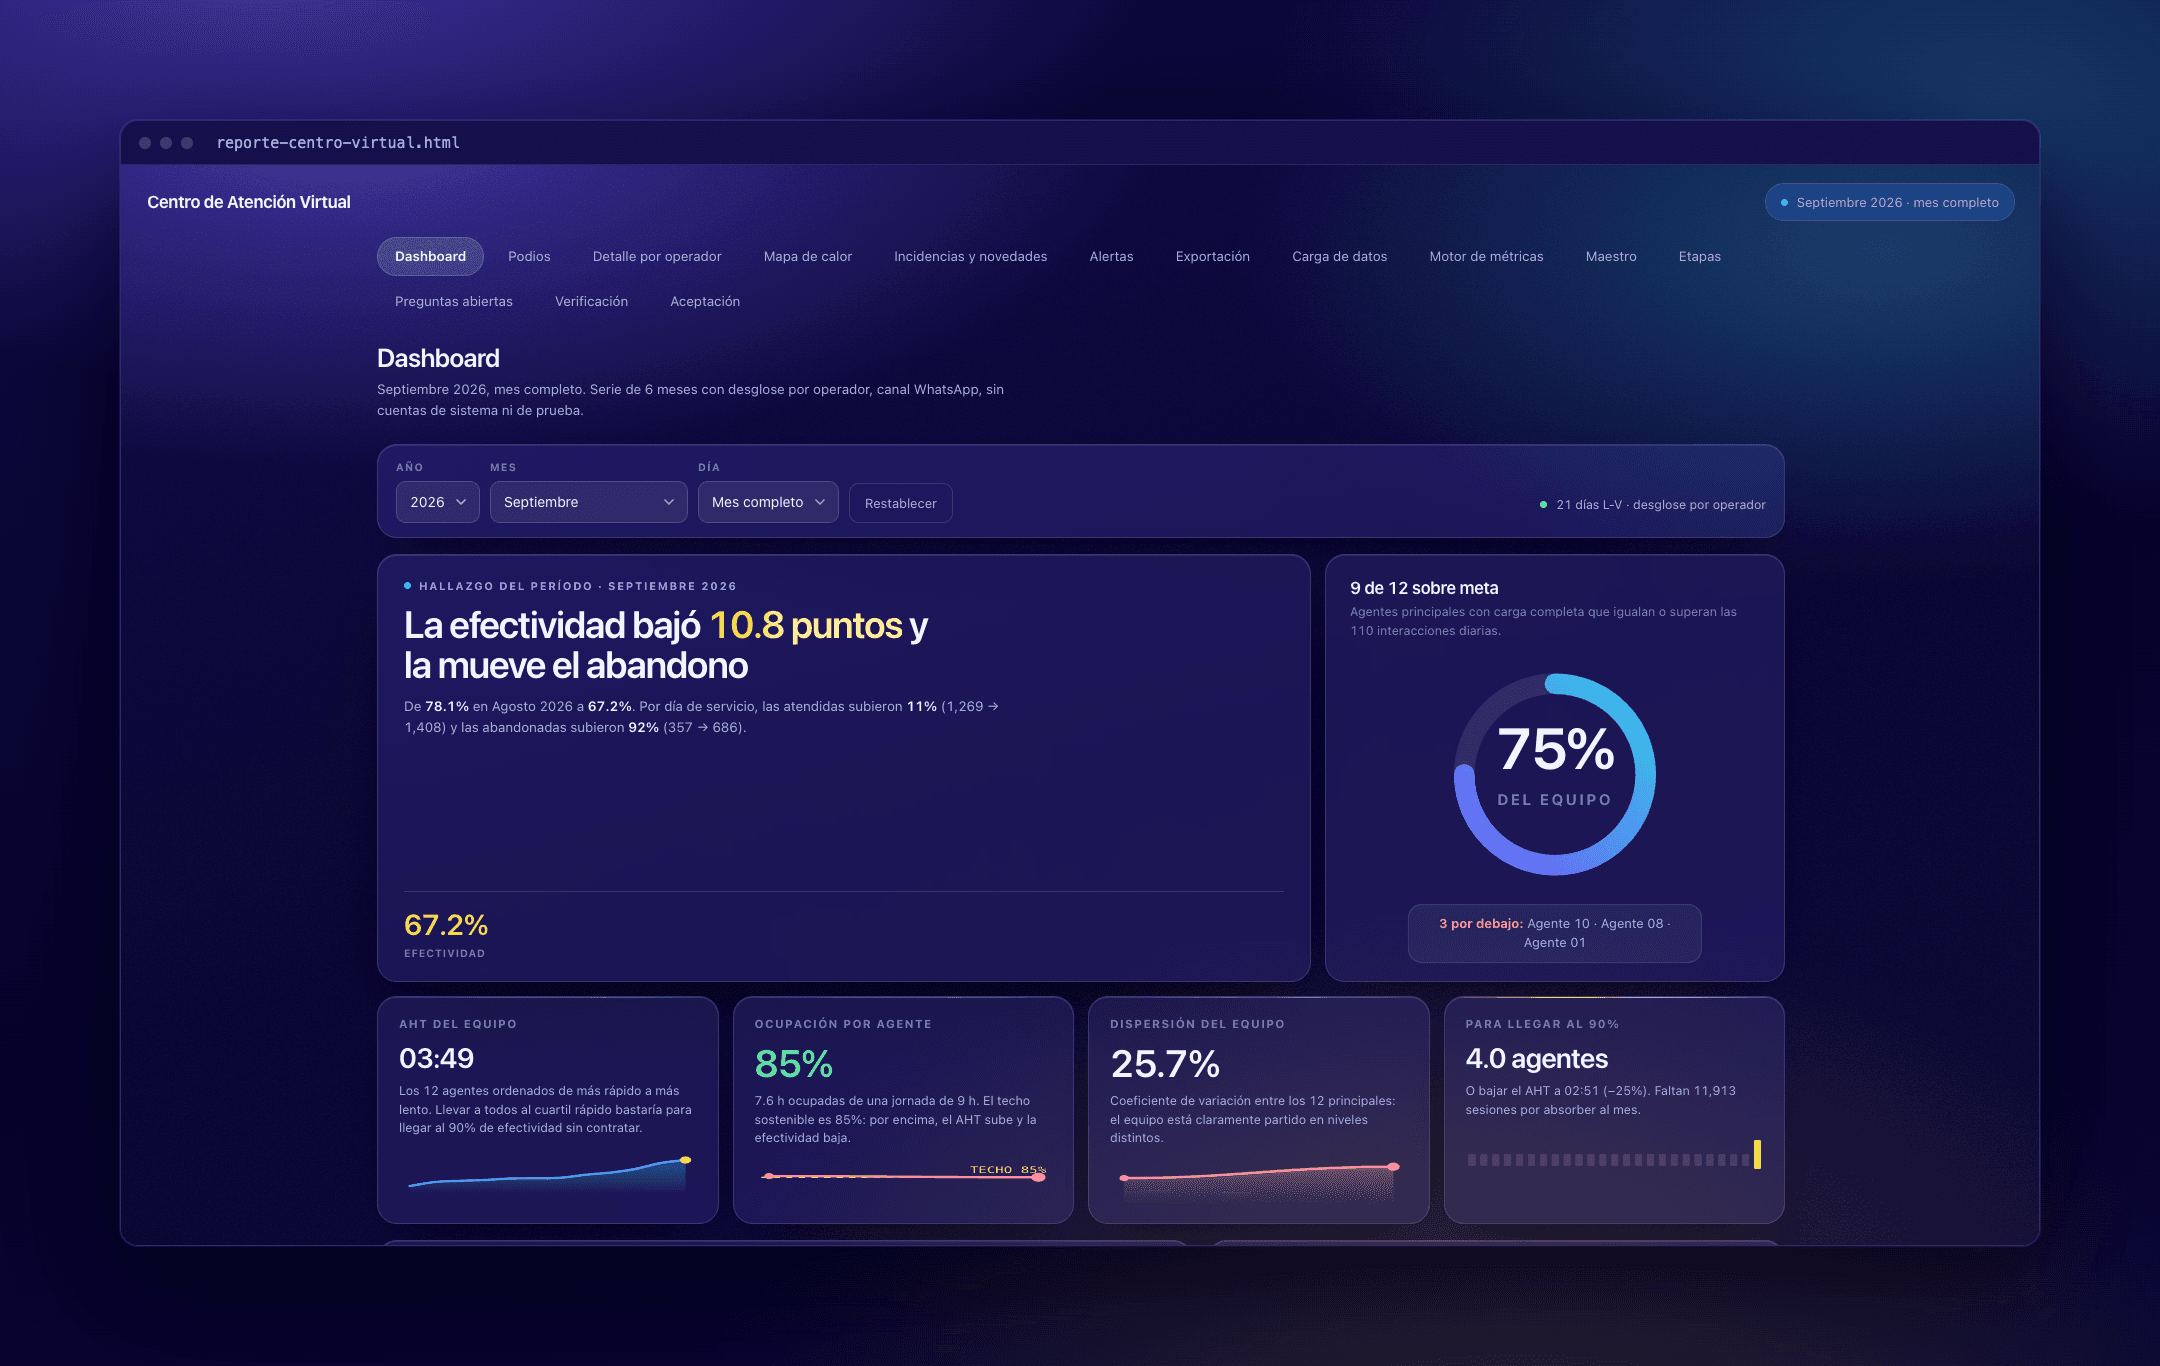
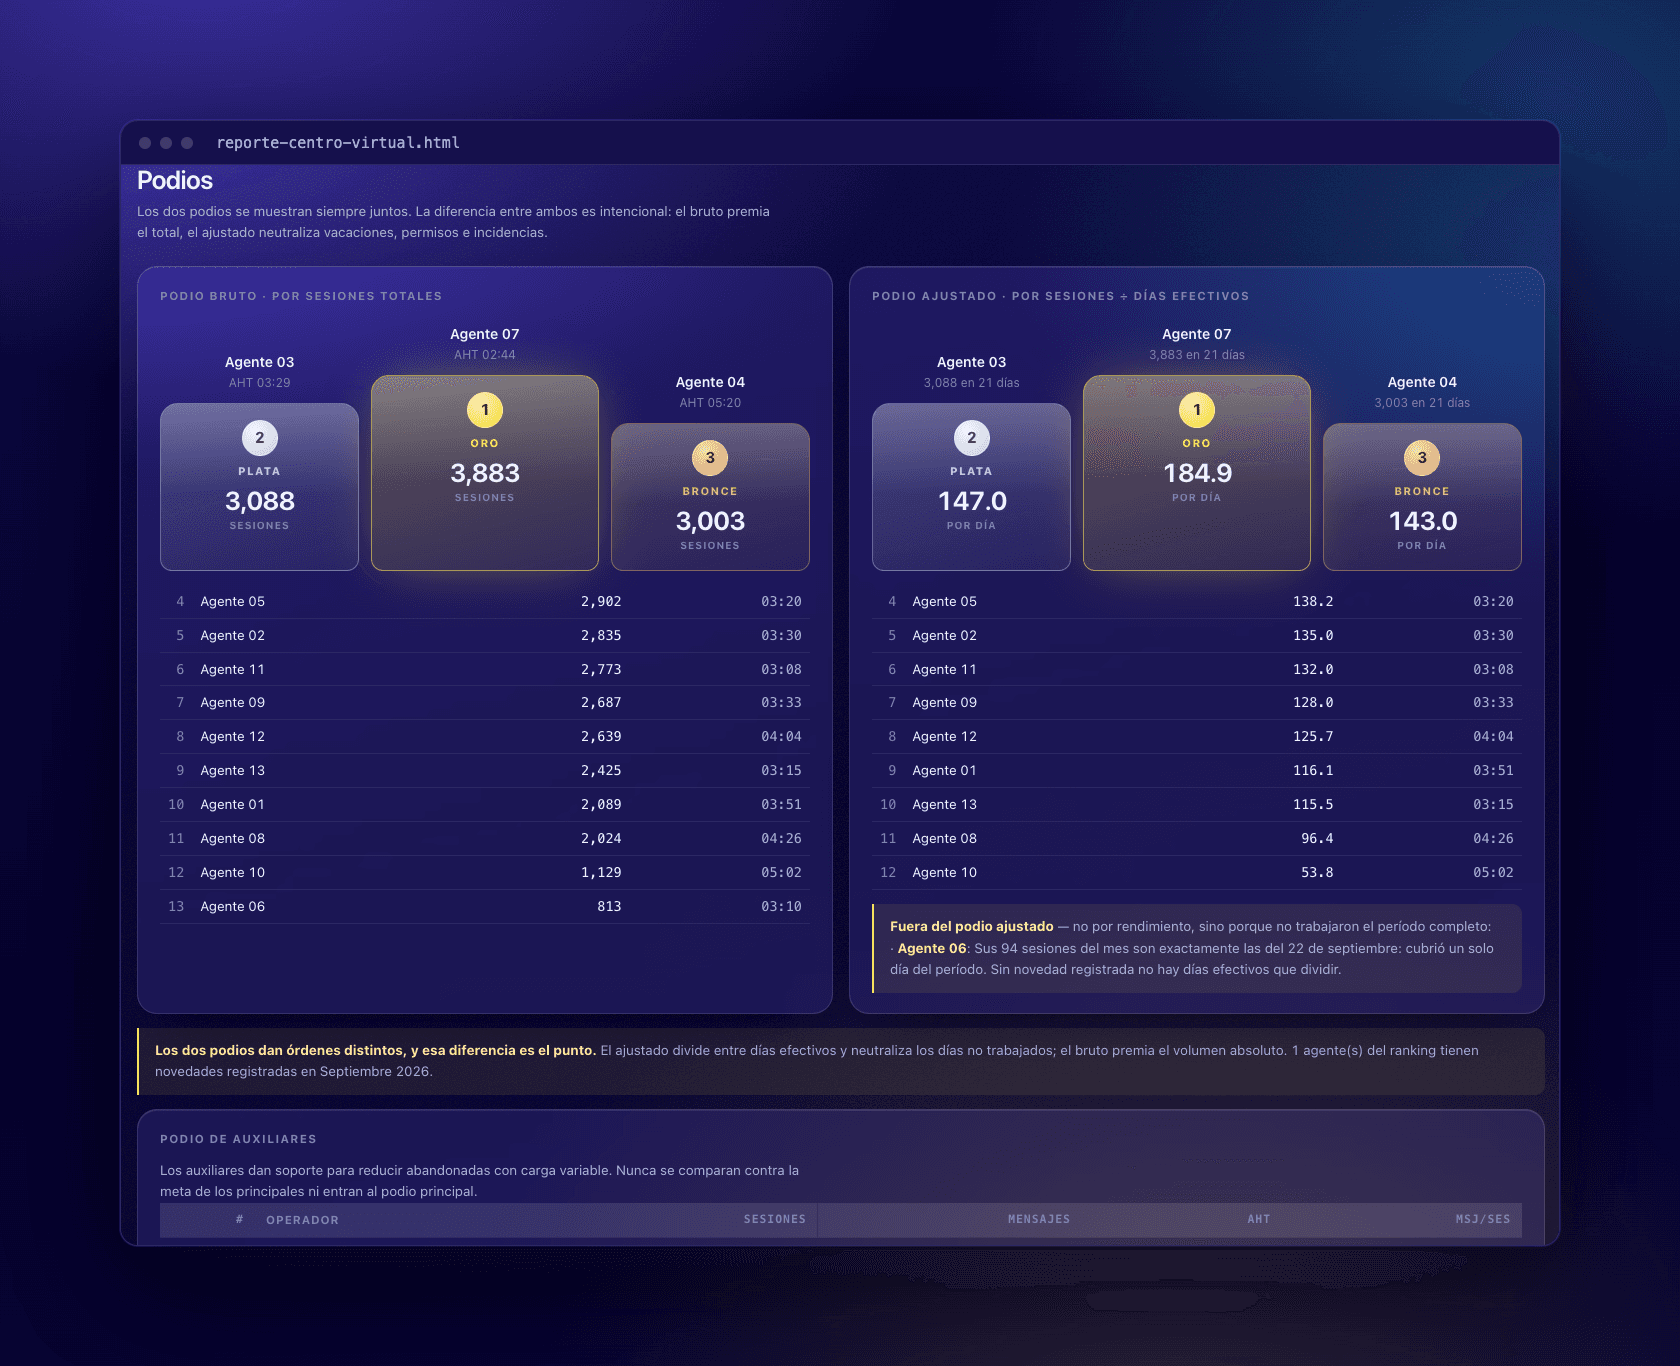
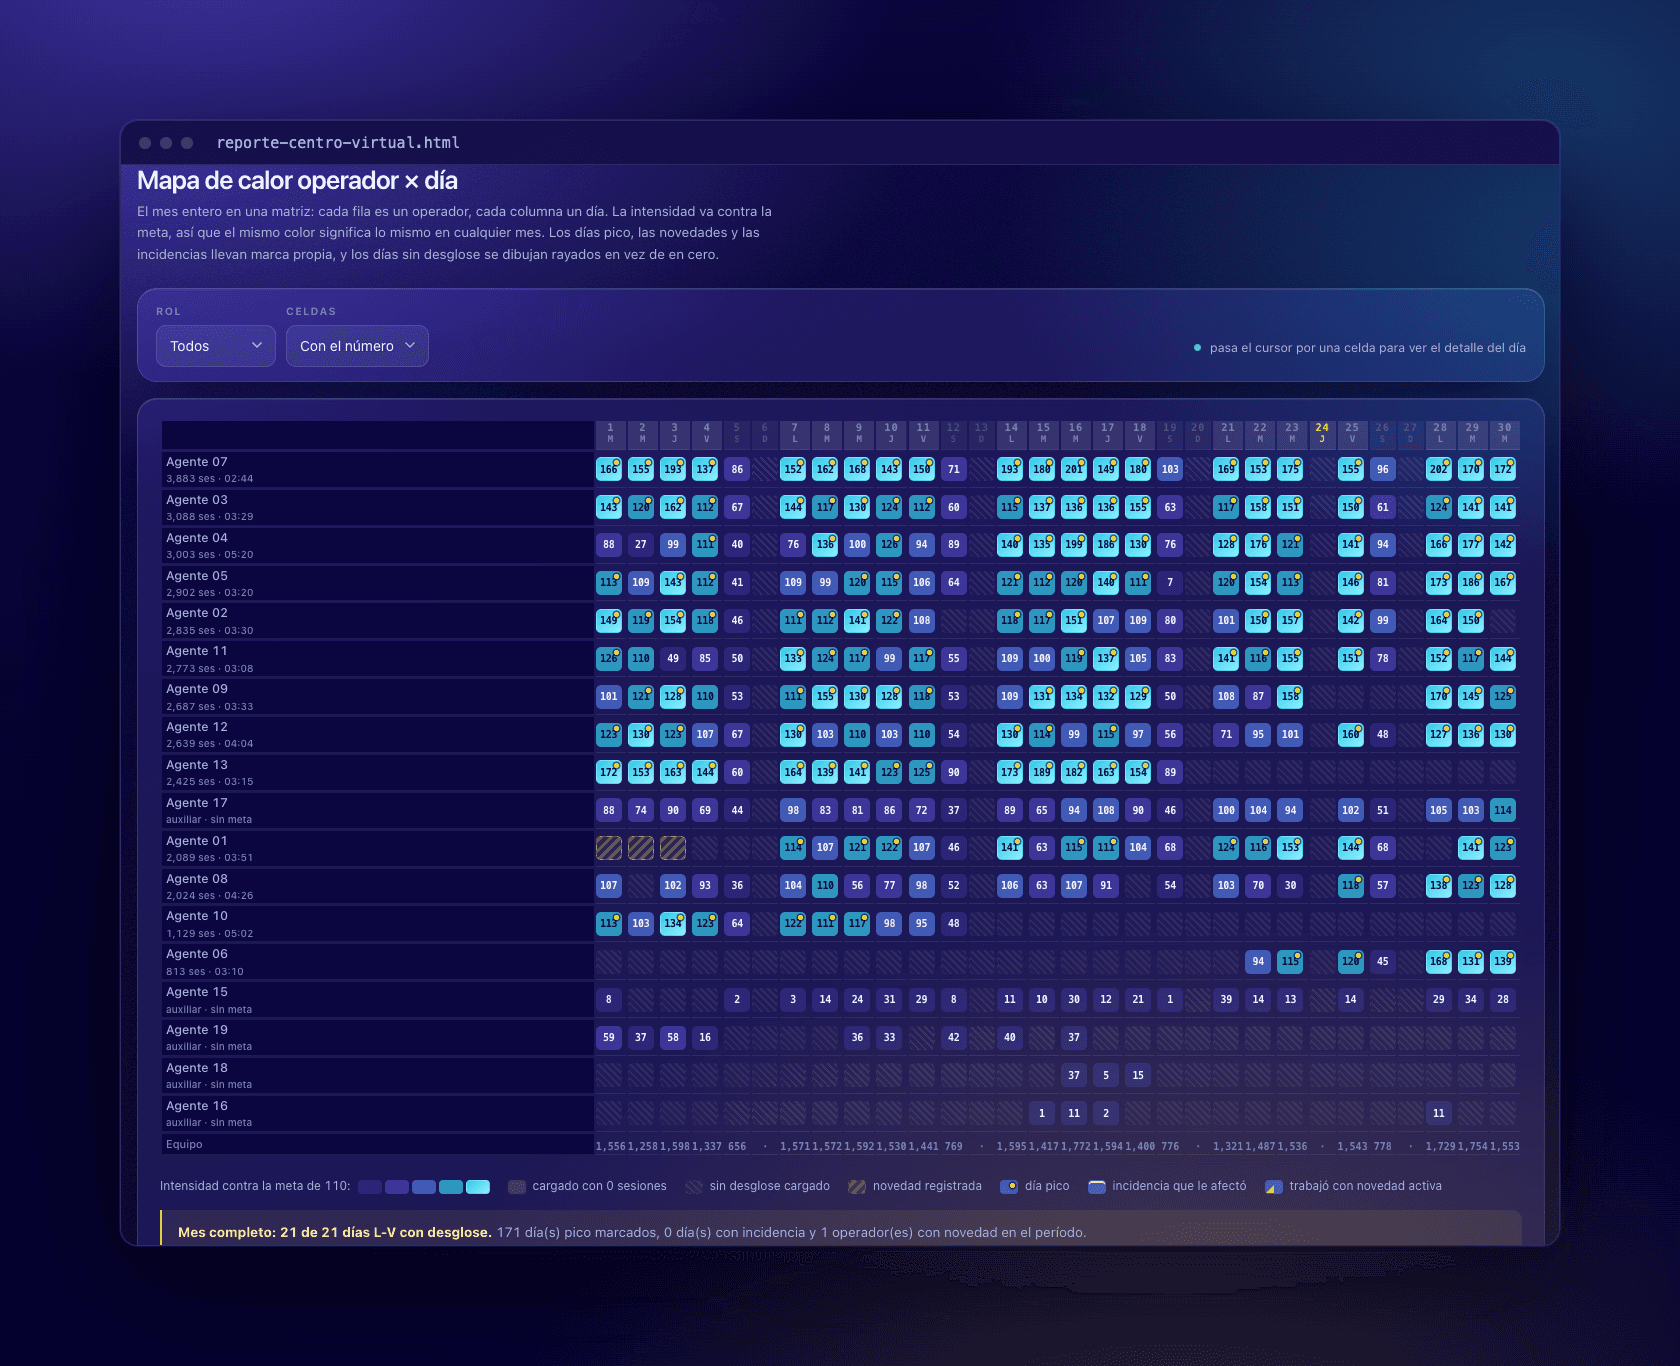
All figures shown are sample data.
Before & after
The problems we've already rebuilt.
This is what our clients came to us with. Drag the handle to see what they run on now.
Leads slip through the cracks.
Follow-up happens by memory, not by system.
Your data lives in ten places.
Spreadsheets, inboxes, and paper. None of them talk.
You decide without numbers.
By the time the report is ready, the month is over.
Financial OS
Web appFrom spreadsheet to system
Eighteen spreadsheet tabs that only worked if you followed eight manual steps — replaced by one system that alerts you instead.
$7,375 in untracked spending identified in the first month.
Before
- An 18-tab workbook: job costing, vehicles, assets, taxes, cash flow.
- Eight manual steps, in order, or the numbers stopped matching.
- A second book with one hand-typed sheet per project.
After
- Live cash position, no closing ritual required.
- Automatic alerts for overdue invoices, taxes, stock, and receipts.
- Jobs, invoices, payroll, inventory, fleet, and real estate in one place.
How we work
You see it working before you pay for all of it.
- 01
Understand your data and operation
We start with how the work actually runs and what your numbers say today.
- 02
Prototype
You get a working version early, so you react to something real instead of a spec.
- 03
Build
We build in short cycles, with a demo at each one so you always see progress.
- 04
Measure the impact
We agree on the business number up front, then check it once the tool is running.
Collaborations
Companies we've collaborated with.


Running in production
Systems people use every day to do their job.
Led by a data scientist
Every tool starts from an analysis of your data, not from a template.
Measured impact
Every project ends with a business metric.
Let's start with your data.
Tell us how your operation runs and what you need to see. We'll reply within 24–48 hours to set up a short call.